Pollar
Interactive polling and data visualization platform
What is Pollar? Complete Overview
Pollar is a web-based platform designed for creating, conducting, and visualizing polls and surveys. The tool offers interactive data representation through graphs and maps, making it easy to understand complex survey results. It serves individuals and organizations looking to gather insights through polling, with features for both simple questionnaires and more sophisticated survey projects. The platform emphasizes user-friendly interfaces while providing advanced data visualization capabilities.
Pollar Interface & Screenshots

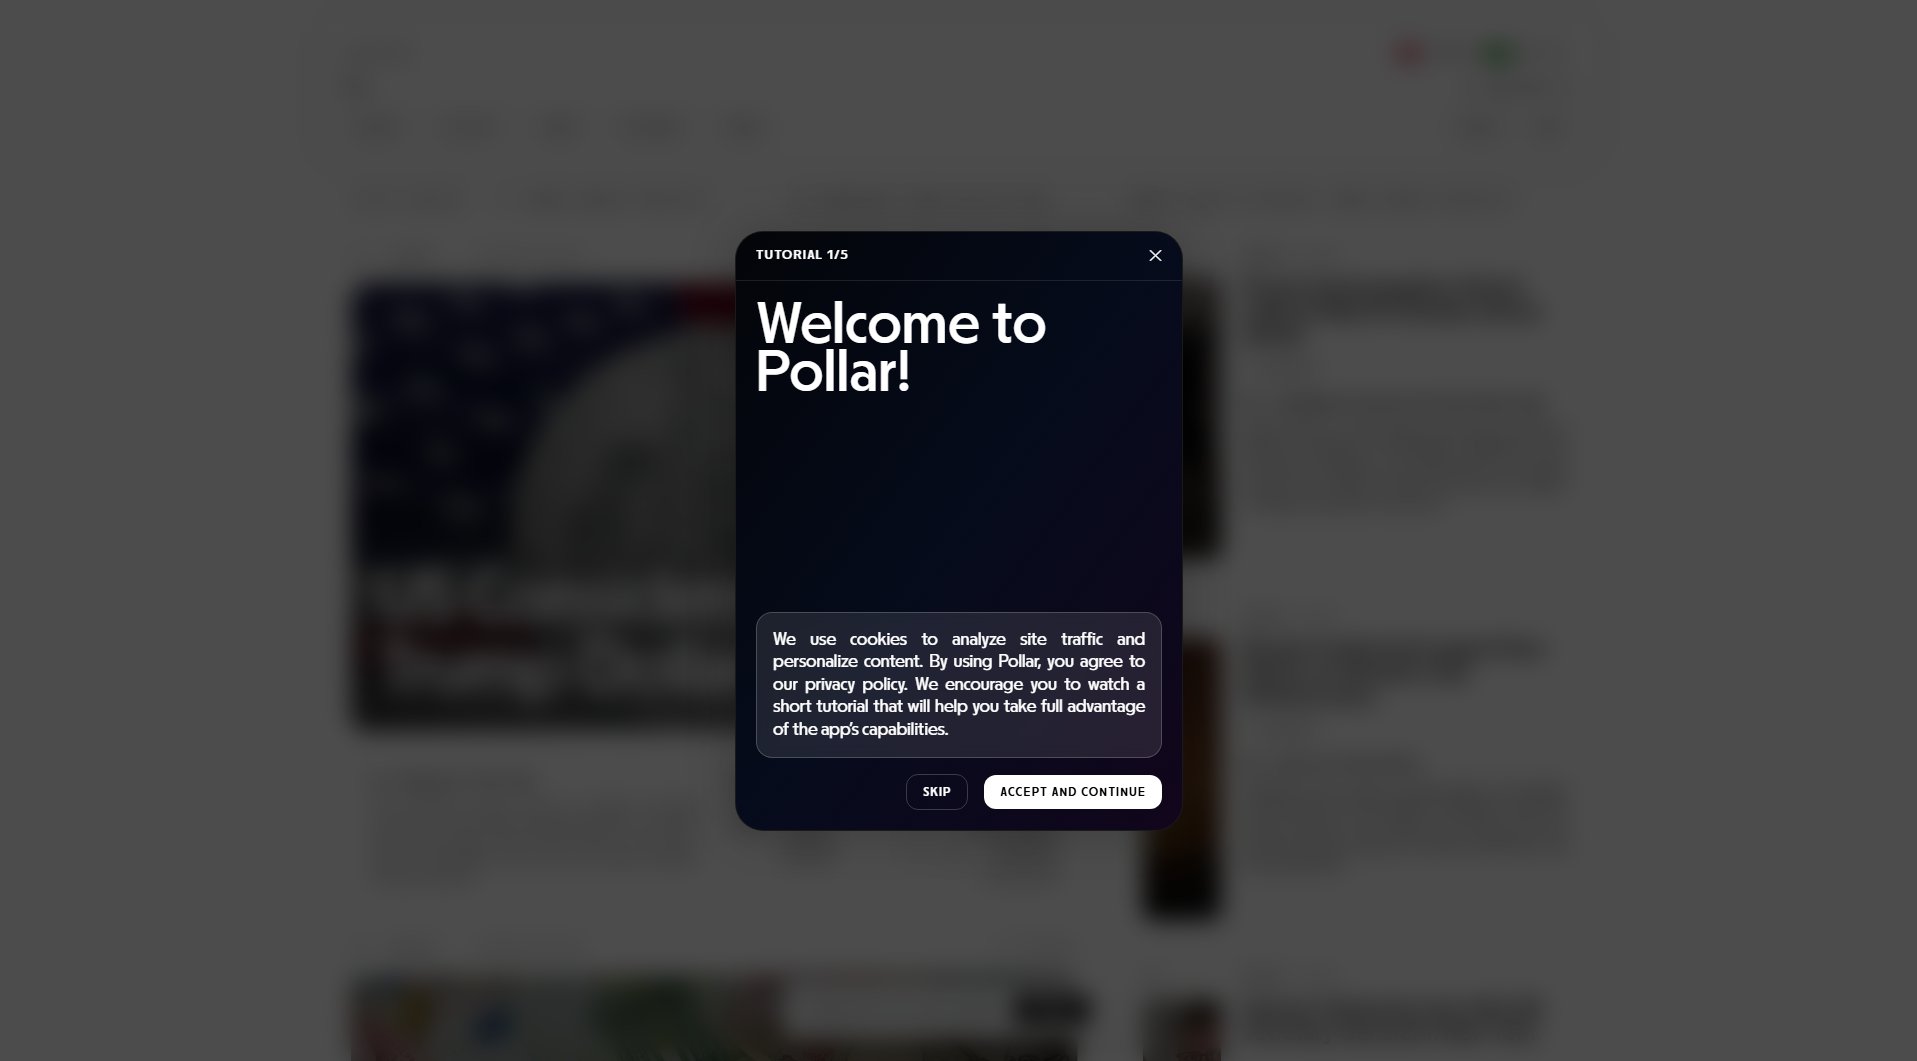
Pollar Official screenshot of the tool interface
What Can Pollar Do? Key Features
Interactive Poll Creation
Easily create and customize polls with various question types and response options. The intuitive interface allows for quick setup without requiring technical expertise.
Data Visualization
Transform survey results into clear, interactive graphs and charts that help identify trends and patterns in the collected data.
Geographical Mapping
Visualize response data on maps to understand geographical distributions and regional variations in your survey results.
Tutorial Guidance
Step-by-step tutorials help new users quickly learn how to maximize the platform's capabilities for their polling needs.
Best Pollar Use Cases & Applications
Market Research
Businesses can use Pollar to conduct consumer preference surveys, with results visualized geographically to identify regional market trends.
Academic Surveys
Researchers can gather and analyze data from study participants, using the graphing tools to present findings in academic papers or presentations.
Event Planning
Organizers can poll attendees about preferences for schedule, venues, or activities, with real-time results helping to make data-driven decisions.
How to Use Pollar: Step-by-Step Guide
Accept the cookie policy and access the welcome tutorial to familiarize yourself with Pollar's interface and features.
Create a new poll project by selecting question types and response options that suit your survey goals.
Distribute your poll to your target audience using the provided sharing options or embed codes.
Collect responses and monitor incoming data in real-time through the dashboard.
Analyze results using the visualization tools, including graphs and maps, to derive meaningful insights.


