Salesforce Debugger - All in One
Advanced debugging tools for Salesforce developers
What is Salesforce Debugger - All in One? Complete Overview
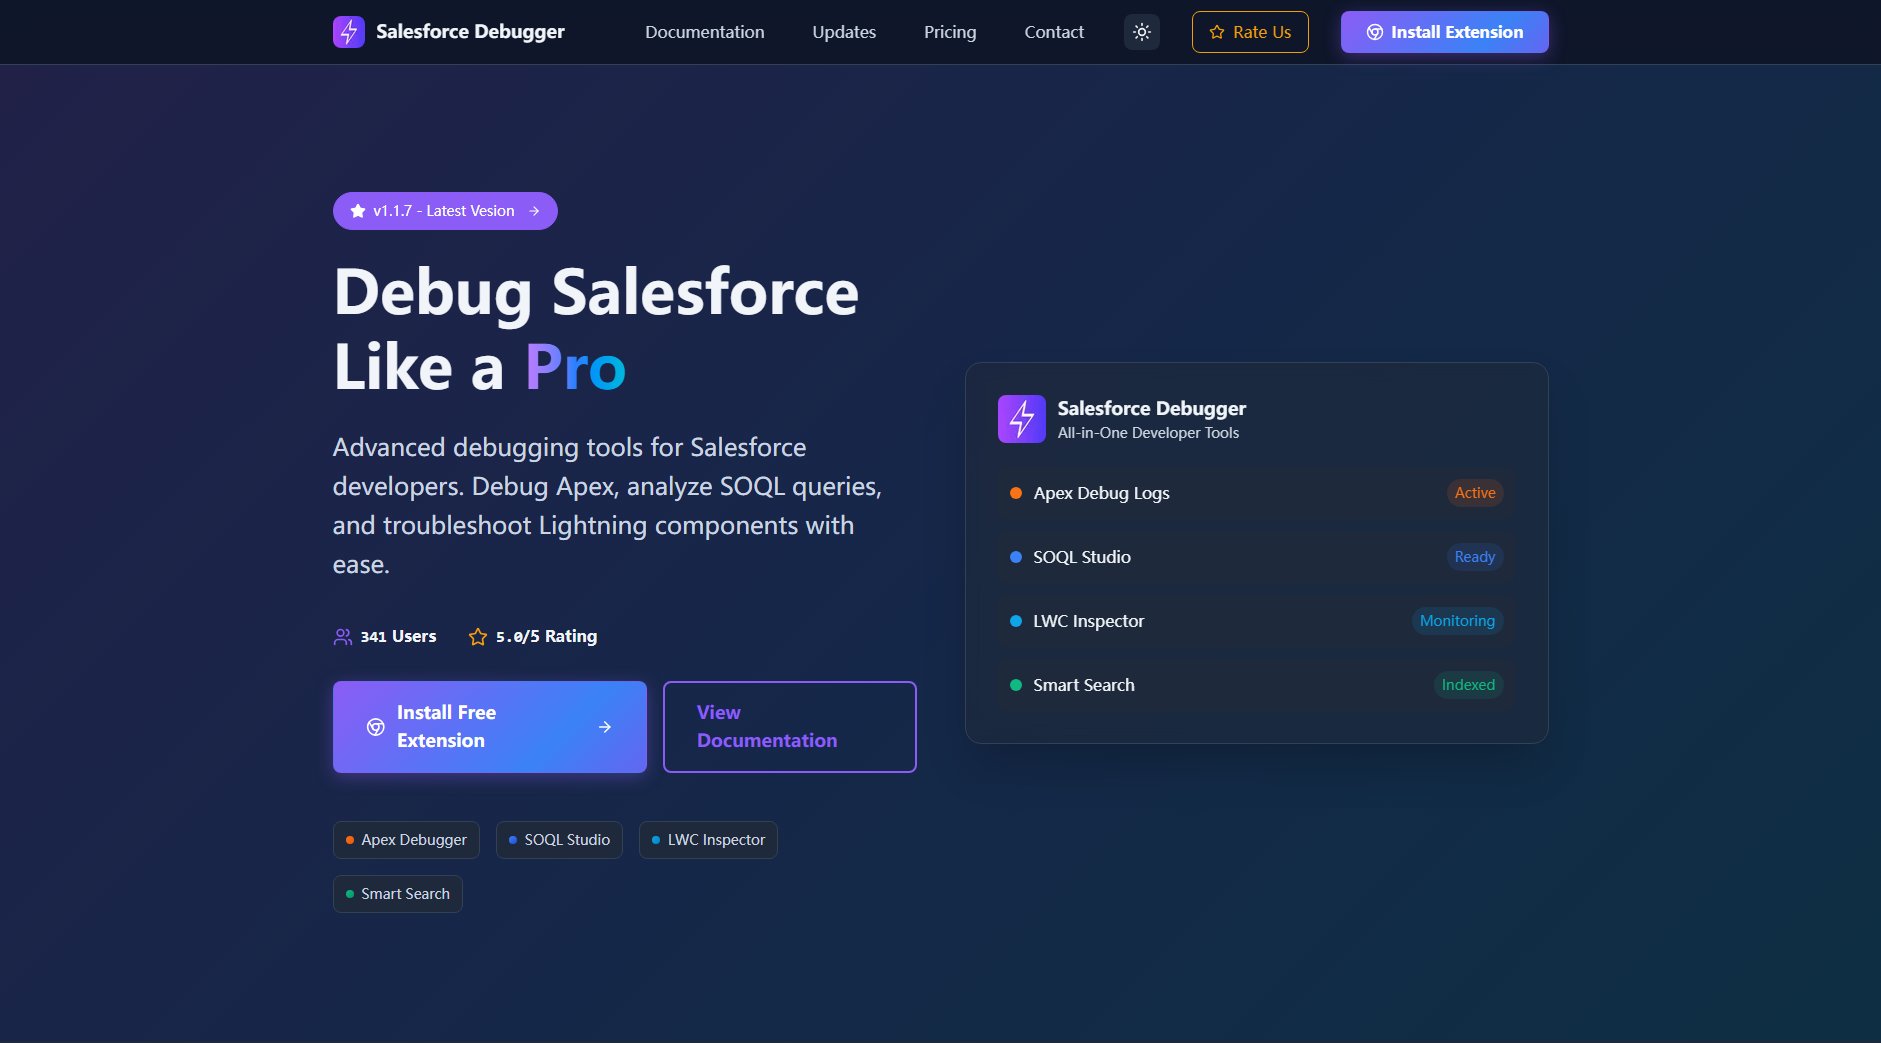
Salesforce Debugger is an all-in-one Chrome extension designed to enhance the debugging experience for Salesforce developers. It provides advanced tools for debugging Apex, analyzing SOQL queries, and troubleshooting Lightning components. The tool addresses common pain points such as inefficient log viewing, lack of advanced SOQL query capabilities, and limited Lightning Web Component inspection. Targeted primarily at Salesforce developers, both beginners and professionals, this extension simplifies complex debugging tasks and improves productivity with its intuitive interface and powerful features.
Salesforce Debugger - All in One Interface & Screenshots

Salesforce Debugger - All in One Official screenshot of the tool interface
What Can Salesforce Debugger - All in One Do? Key Features
Apex Debugger
Enhanced log viewer with optimized UI, deep content search capabilities, and comprehensive trace flag management for efficient debugging. This feature allows developers to quickly navigate through logs, filter relevant information, and manage trace flags directly from the extension.
SOQL Studio
Advanced SOQL query editor with autocomplete, syntax highlighting, field suggestions, and result visualization. Accessible via extension icon or Alt+S shortcut on any Salesforce tab, this tool significantly improves query building and testing efficiency.
LWC Inspector
Inspect component trees, view properties, and understand your Lightning Web Component architecture with advanced debugging capabilities. This feature provides deep insights into LWC structure and behavior, making troubleshooting more effective.
Smart Search
Powerful search engine for finding Apex classes, triggers, flows, and validation rules instantly. This intelligent search functionality helps developers locate exactly what they need without navigating through multiple Salesforce menus.
Advanced Apex Tracking
Track and monitor Apex method calls directly within your Lightning Web Components for complete visibility into application flow. This feature provides real-time insights into method execution and call hierarchy.
Best Salesforce Debugger - All in One Use Cases & Applications
Debugging Complex Apex Code
When troubleshooting complex Apex logic, developers can use the enhanced log viewer to quickly filter relevant debug statements, track execution flow, and identify performance bottlenecks.
Building and Testing SOQL Queries
Developers can leverage the SOQL Studio to rapidly build, test, and optimize queries with field suggestions and syntax highlighting, significantly reducing query development time.
Troubleshooting Lightning Web Components
The LWC Inspector helps developers understand component hierarchies, inspect properties, and debug rendering issues in complex Lightning Web Component applications.
How to Use Salesforce Debugger - All in One: Step-by-Step Guide
Install the Salesforce Debugger extension from the Chrome Web Store. The installation process is straightforward and completes within seconds.
Navigate to any Salesforce page where you need debugging assistance. The extension automatically detects Salesforce environments.
Access the debugging tools through the extension icon in your browser toolbar. Each tool (Apex Debugger, SOQL Studio, LWC Inspector) can be launched independently.
Use the specific debugging tools as needed. For Apex debugging, enable trace flags and view enhanced logs. For SOQL queries, use the studio with its autocomplete features. For LWC inspection, examine component trees and properties.
Utilize keyboard shortcuts (like Alt+S for SOQL Studio) for quick access to frequently used tools during your development workflow.
Salesforce Debugger - All in One Pros and Cons: Honest Review
Pros
Considerations
Is Salesforce Debugger - All in One Worth It? FAQ & Reviews
Yes, all features are currently available for free. The developers maintain it as a passion project for the Salesforce community.
The extension is compatible with Chrome and Firefox browsers.
The extension receives regular updates with new features and improvements. The latest version is v1.1.7 as of September 2025.
Yes, the extension is safe to use in all Salesforce environments including production. It only provides debugging capabilities without modifying any data.
While the extension is free, you can support development through donations via UPI (for Indian users) or platforms like Buy Me a Coffee and Ko-fi.