Make Graph
Free online graph maker with accessibility features for all
What is Make Graph? Complete Overview
Make Graph is an online free graph maker designed to create accessible charts for everyone. It specializes in visual pattern textures that help distinguish data series, making your charts usable by individuals with color vision differences. The tool is perfect for professionals, educators, and businesses that need to present data in an inclusive way. With features like Aria Decal Patterns, Make Graph ensures that your charts are not only visually appealing but also accessible when printed in grayscale or viewed by those with visual impairments.
Make Graph Interface & Screenshots

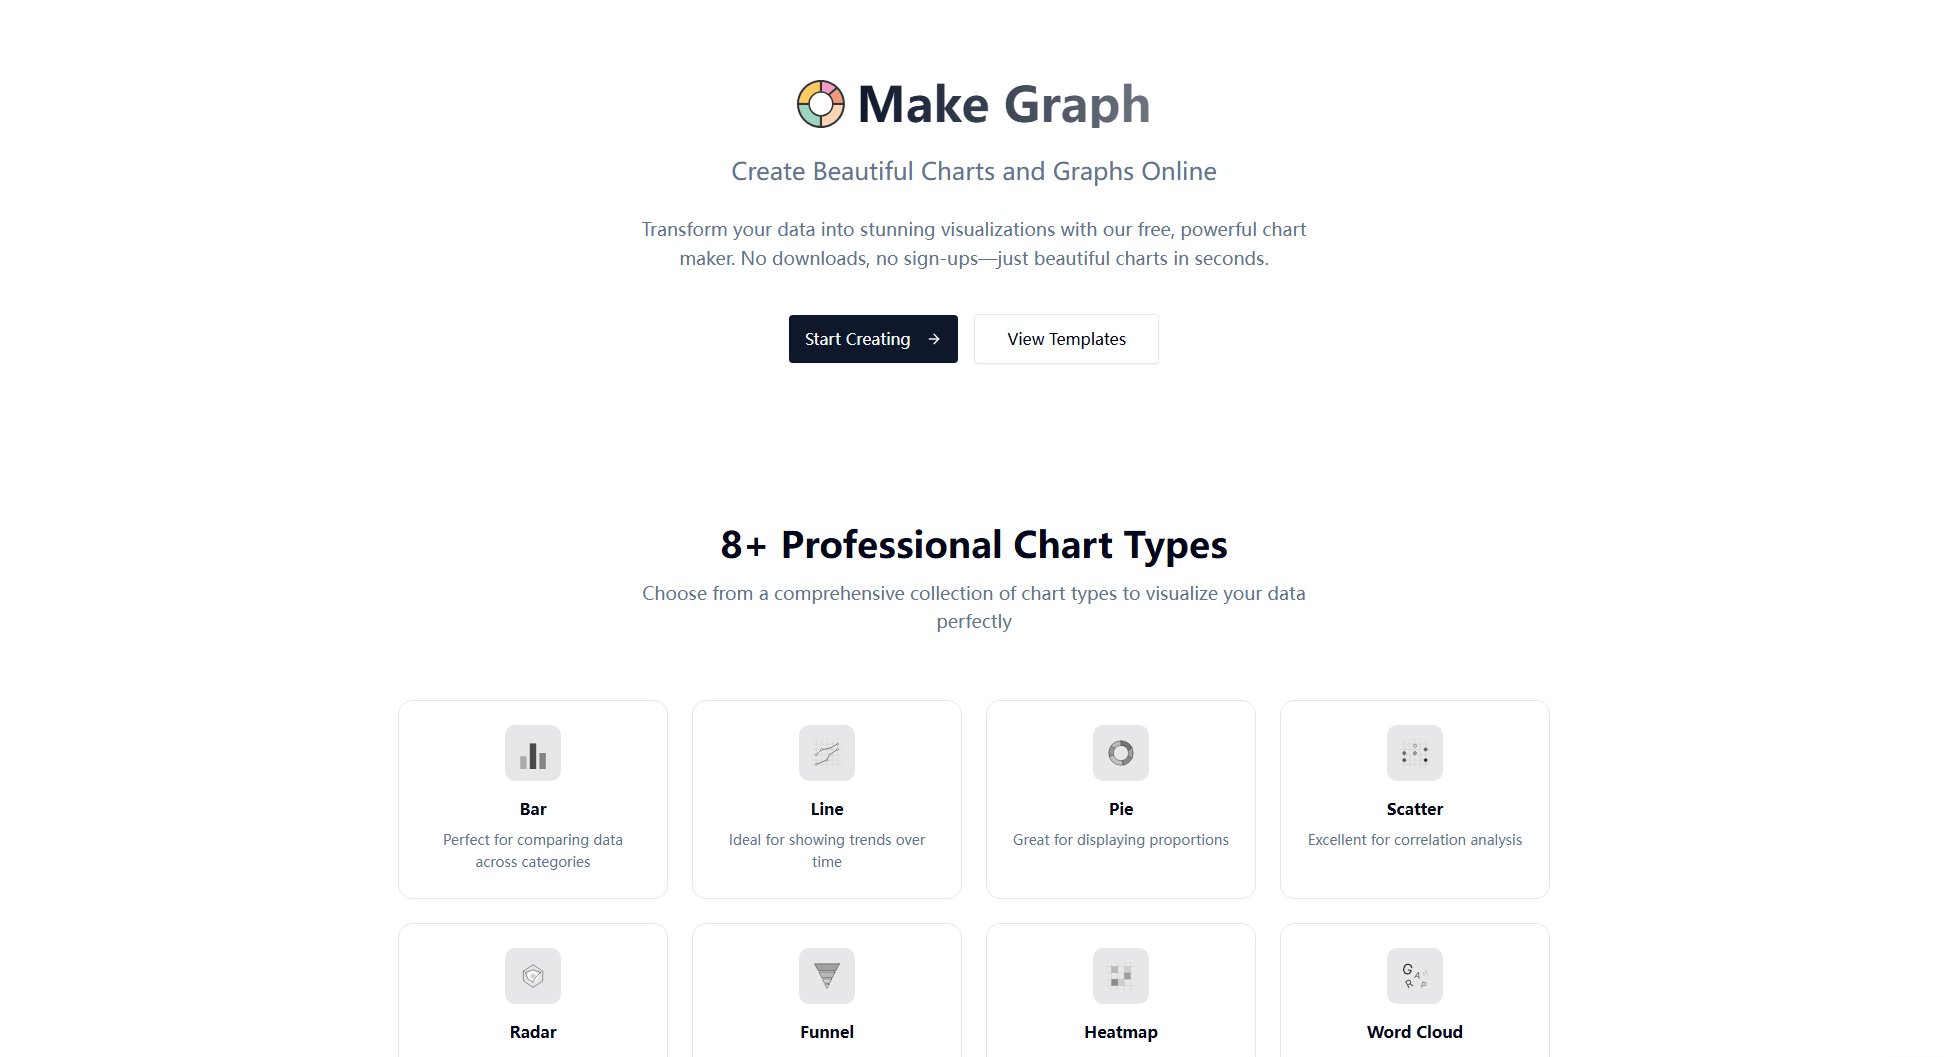
Make Graph Official screenshot of the tool interface
What Can Make Graph Do? Key Features
Aria Decal Patterns
Aria Decal Patterns add visual textures to chart elements, making them distinguishable even without color. This feature is essential for users with color vision differences and ensures accessibility in grayscale prints or presentations.
Enhanced Accessibility
Make Graph provides visual patterns and textures that help users with color vision differences distinguish between different data series, ensuring your charts are accessible to everyone.
Better Data Recognition
Pattern textures offer an additional visual cue beyond color, making it easier to identify and compare different data categories at a glance, improving data comprehension for all users.
Best Make Graph Use Cases & Applications
Educational Materials
Educators can use Make Graph to create accessible charts for students with color vision differences, ensuring all students can understand the data presented.
Business Reports
Businesses can generate inclusive reports with charts that are easily distinguishable even in grayscale, making them accessible to all stakeholders.
Public Presentations
Presenters can use Make Graph to create slides with charts that are clear and accessible to audience members with varying visual abilities.
How to Use Make Graph: Step-by-Step Guide
Visit the Make Graph website and start a new project by selecting the type of chart you want to create.
Input your data or use the sample data provided to populate your chart.
Navigate to the settings panel and enable the Aria Decal patterns feature to add visual textures to your chart elements.
Customize your chart further with labels, titles, and other formatting options to suit your needs.
Save or export your completed chart for use in presentations, reports, or online sharing.
Make Graph Pros and Cons: Honest Review
Pros
Considerations
Is Make Graph Worth It? FAQ & Reviews
Yes, Make Graph is completely free to use with no hidden charges. You can create and export your charts without any cost.
Yes, the charts you create with Make Graph can be used for both personal and commercial purposes without any restrictions.
You can enable Aria Decal Patterns in the settings panel of the chart editor. This feature adds visual textures to make your charts more accessible.
Make Graph supports various chart types including bar charts, line charts, pie charts, and more, all with accessibility features.
Yes, you can export your charts in multiple formats for use in presentations, reports, or online sharing.


