ToDiagram
Interactive data diagramming tool for JSON, YAML, CSV & XML
What is ToDiagram? Complete Overview
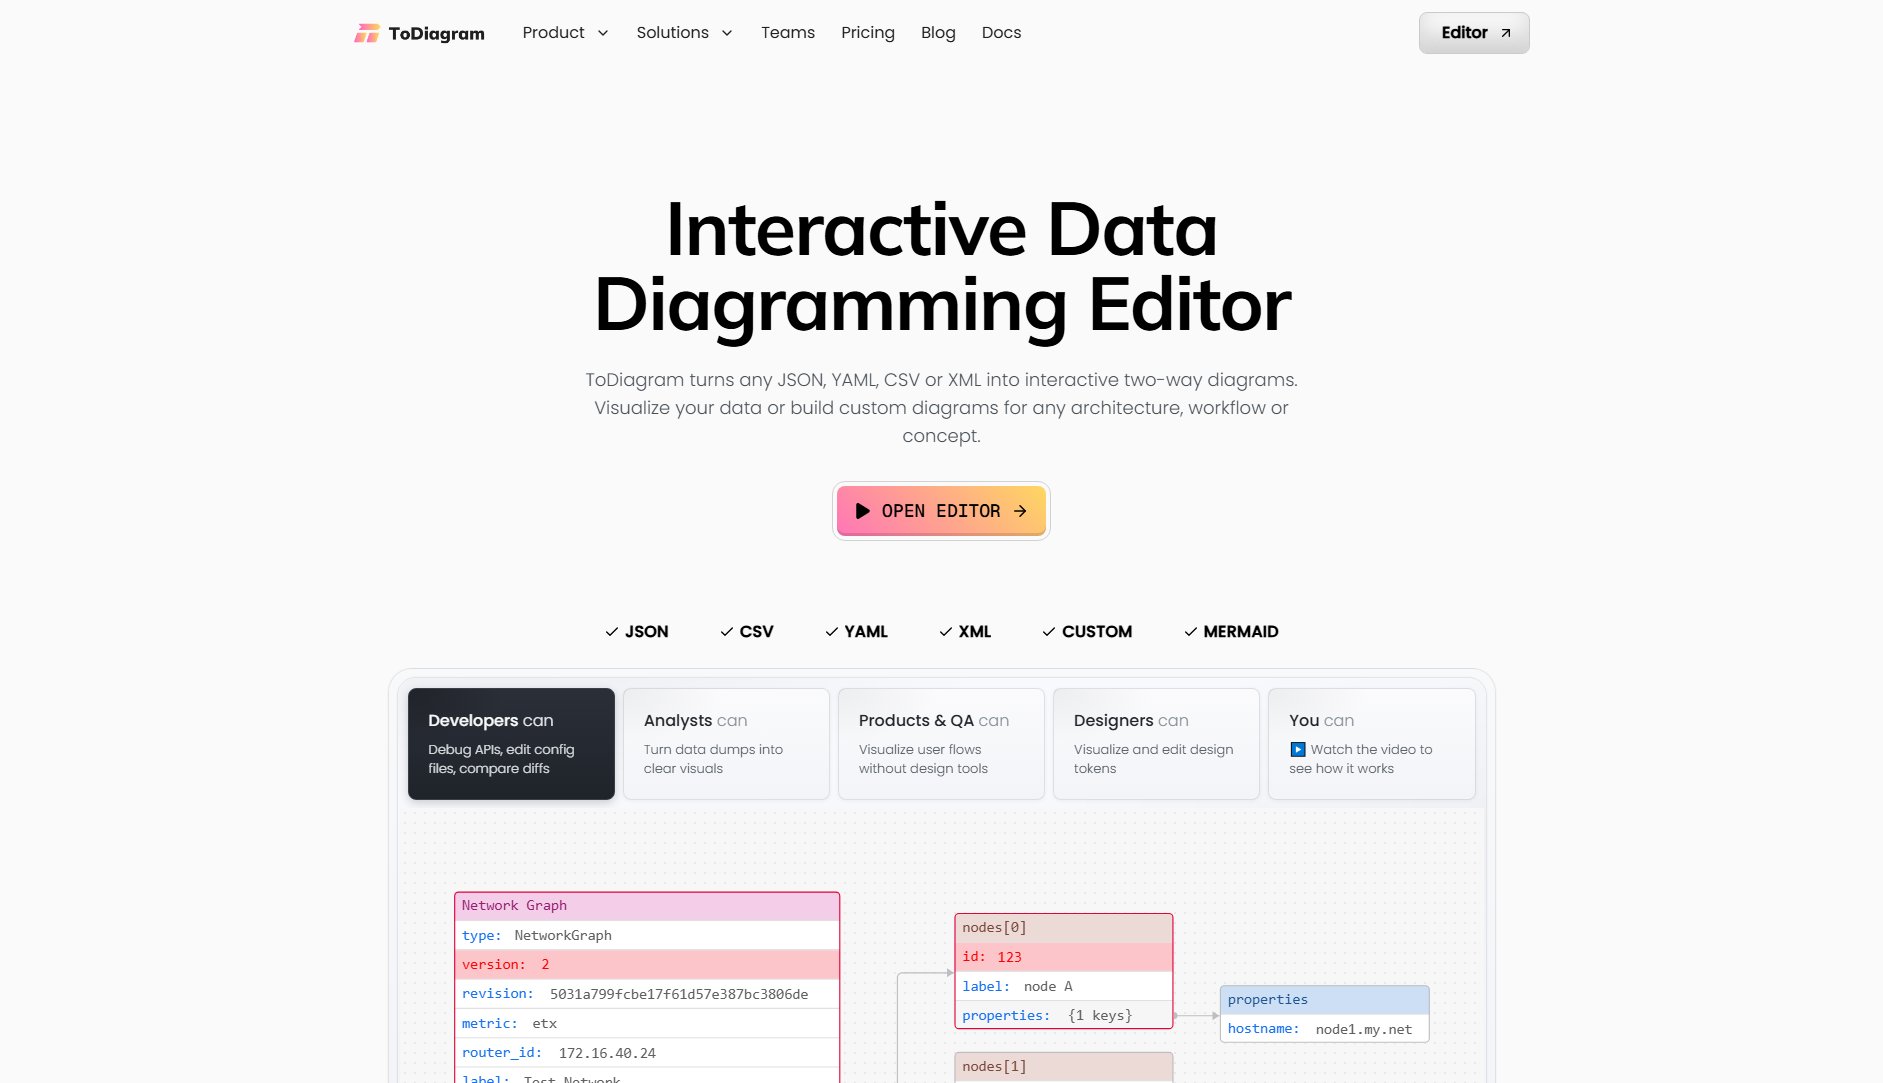
ToDiagram is an intuitive web-based tool that transforms structured data formats like JSON, YAML, CSV, and XML into interactive, two-way diagrams. It helps users visualize complex data structures, making it easier to understand, edit, and manage data for various purposes including API debugging, data analysis, workflow visualization, and design token management. The tool is designed for developers, analysts, product managers, QA professionals, and designers who need to work with structured data but prefer a visual approach. With features like real-time editing, cloud storage, and team collaboration, ToDiagram simplifies data interaction without requiring syntax knowledge.
ToDiagram Interface & Screenshots

ToDiagram Official screenshot of the tool interface
What Can ToDiagram Do? Key Features
Interactive Two-Way Diagrams
Convert JSON, YAML, CSV, or XML data into interactive diagrams that allow both visualization and editing. Changes in the diagram reflect in the raw data and vice versa, enabling seamless data manipulation.
Real-Time Visualization & Editing
Visualize complex data structures in real-time and edit them directly through the diagram interface. This eliminates the need to manually parse and modify raw data files.
Chrome Extension
The ToDiagram Chrome Extension allows users to select and visualize JSON, YAML, or other structured data directly from any webpage, eliminating the need for copy-pasting into a separate tool.
Cloud Storage & Collaboration
Save diagrams in the cloud, access them from any device, and share with team members for collaborative editing and review.
Text to Diagram AI
Automatically convert text descriptions into structured diagrams using AI, saving time on manual diagram creation for common data structures.
JSON Schema Validation
Validate your data against JSON schemas to ensure structural integrity and catch errors early in the development process.
Search and Filter
Quickly find specific nodes in large datasets with instant search and filtering capabilities, making navigation through complex data structures effortless.
Multiple Export Options
Export diagrams as PNG, JPEG, or SVG files for sharing, documentation, or embedding in presentations and reports.
Best ToDiagram Use Cases & Applications
API Development and Debugging
Developers can visualize API responses and configuration files to quickly identify structural issues, compare different versions, and understand complex nested structures that would be difficult to parse in raw JSON or YAML format.
Data Analysis and Visualization
Analysts working with large CSV or JSON data dumps can transform them into interactive diagrams to spot patterns, relationships, and anomalies that might be missed in spreadsheet views or raw data.
User Flow Documentation
Product managers and QA teams can create and modify user flow diagrams directly from structured data without needing design software, making it easier to document and communicate application workflows.
Design System Management
Designers can visualize and edit design tokens stored in JSON format, maintaining a clear overview of the design system's structure while being able to make changes directly through the visual interface.
Educational Tool
Educators and students can use ToDiagram to teach and learn about data structures, making abstract concepts concrete through visual representation and interactive exploration.
How to Use ToDiagram: Step-by-Step Guide
Open the ToDiagram editor by visiting the website or using the Chrome Extension to select data directly from a webpage.
Input your data by pasting JSON, YAML, CSV, or XML content into the editor, or upload a file from your device.
View your data automatically transformed into an interactive diagram. Navigate through the structure by expanding/collapsing nodes.
Edit the diagram visually by adding, removing, or modifying nodes. Changes will be reflected in the raw data view in real-time.
Use search to find specific nodes, validate against schemas if needed, and apply any AI transformations to restructure your data.
Save your diagram to the cloud (for Pro users), share it with team members, or export it in your preferred image format.
ToDiagram Pros and Cons: Honest Review
Pros
Considerations
Is ToDiagram Worth It? FAQ & Reviews
ToDiagram is an intuitive data editor that transforms structured data formats like JSON, CSV, YAML, and XML into interactive diagrams. It helps users work with complex datasets visually, making it easier to understand, modify, and explore data relationships.
Yes, your data is processed locally in your browser and never sent to our servers unless you choose to save it in your cloud account. We prioritize user privacy and data security.
ToDiagram supports JSON, CSV, YAML, and XML formats, along with custom diagram formats for specialized use cases.
ToDiagram can handle datasets of any size by intelligently chunking large files to maintain performance. There are no hard limits on file size.
Yes, you can install ToDiagram as a Progressive Web App (PWA) for offline use, though some features like cloud saving and AI tools require an internet connection.
Yes, the Teams plan includes features for sharing documents with team members and centralized billing management for organizations.
You can contact the ToDiagram team at [email protected] for assistance with complex data structures or specialized use cases.


