Textify Analytics
AI powered search engine for Data Lovers
What is Textify Analytics? Complete Overview
Textify Analytics is an advanced AI-powered search engine designed for data enthusiasts, researchers, and professionals who need quick and insightful data visualization. The platform allows users to search over 5,717,263 charts and customize them to fit their needs. It caters to a wide range of audiences including researchers, product managers, sales teams, marketers, and more. Textify Analytics solves the pain points of time-consuming data visualization and limited access to diverse data sources by providing an intuitive platform with unlimited chart options and priority support.
Textify Analytics Interface & Screenshots

Textify Analytics Official screenshot of the tool interface
What Can Textify Analytics Do? Key Features
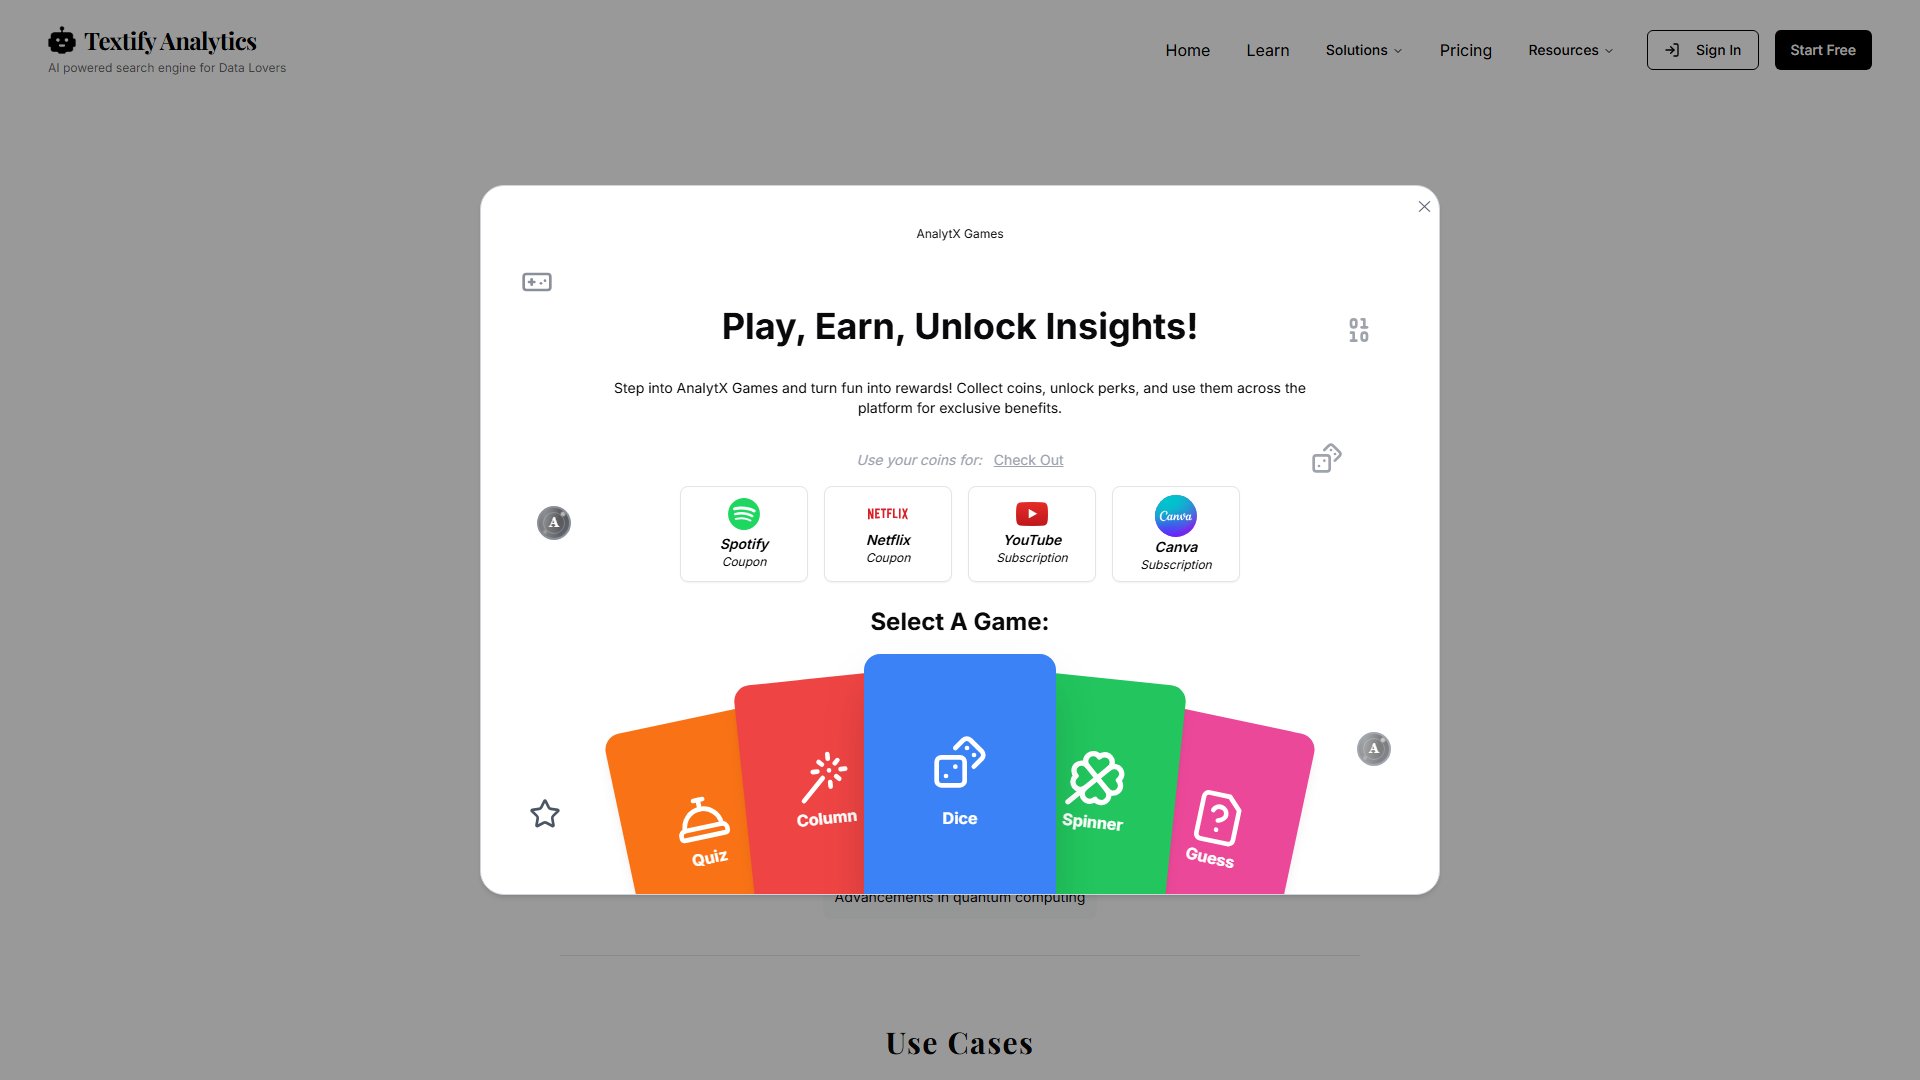
AnalytX Games
Engage in fun games to earn Analytx coins which can be used to unlock perks like Spotify coupons, Netflix coupons, YouTube subscriptions, and Canva subscriptions. Games include Quiz, Column, Dice, Spinner, and Guess.
Customize Charts
Users can customize charts to visualize data in various formats including bar charts, pie charts, geo charts, organization charts, and time series charts. The platform supports over 15+ chart types per prompt.
Chart My Data
Upload your own data to create customized charts and tables, gaining insights in seconds. This feature costs 5 coins per request.
Diagram Studio
Access advanced visualization tools to create diagrams from your prompts. This feature costs 5 coins per diagram.
Deep AI Insights
Get in-depth AI analysis delivered directly to your email. This premium feature costs 20 coins per analysis.
Generate Dashboard
Create a comprehensive dashboard from your bookmarked collection of charts. This feature costs 20 coins per dashboard.
Best Textify Analytics Use Cases & Applications
Research
Researchers can use Textify Analytics to quickly visualize data trends, such as renewable energy research trends, and export charts for academic papers.
Product Development
Product teams can analyze customer feedback data and visualize it to make informed decisions about new features.
Sales and Marketing
Sales and marketing teams can create visual reports to track performance metrics and present data-driven strategies.
Educational Workshops
Educators can use the platform to teach data analytics concepts, leveraging the Diagram Studio and other tools for interactive learning.
How to Use Textify Analytics: Step-by-Step Guide
Sign up for a free account or choose a Pro plan to unlock advanced features.
Search for charts or upload your own data to visualize. Use the 'Chart My Data' feature for custom insights.
Customize your charts using the Diagram Studio or other customization tools available.
Use Analytx coins earned from games to unlock premium features or purchase additional coins.
Export your charts or dashboards for presentations or further analysis.
Textify Analytics Pros and Cons: Honest Review
Pros
Considerations
Is Textify Analytics Worth It? FAQ & Reviews
Analytx coins can be used to unlock premium features such as Diagram Studio, Chart My Data, Deep AI Insights, and Generate Dashboard. They can also be used to redeem perks like Spotify coupons and Netflix subscriptions.
Yes, the Basic plan is free and allows access to 2 charts per prompt with limited data sources.
Monthly Pro costs $5/month and includes 200 Analytx coins, while Yearly Pro costs $50/year and includes 2000 Analytx coins. Both plans offer unlimited charts and priority support.
Yes, you can upgrade from Basic to any Pro plan at any time to unlock additional features and coins.
Yes, all Pro plans come with a 100% money-back guarantee.


