KnowDeck
Advanced visualization platform for learning and presenting
What is KnowDeck? Complete Overview
KnowDeck is an advanced visualization platform designed to enhance learning and presentation experiences. It specializes in creating complex diagrams and interactive visualizations, making it easier for users to understand and present intricate concepts. The platform supports various tools and libraries to demonstrate advanced visualizations, including algorithms, data structures, network architectures, and machine learning pipelines. Target users include students, educators, and professionals who need to visualize complex information in an intuitive and engaging manner. Currently in early phases, KnowDeck is continuously improving and expanding its features to provide better model support and extended usage capabilities.
KnowDeck Interface & Screenshots

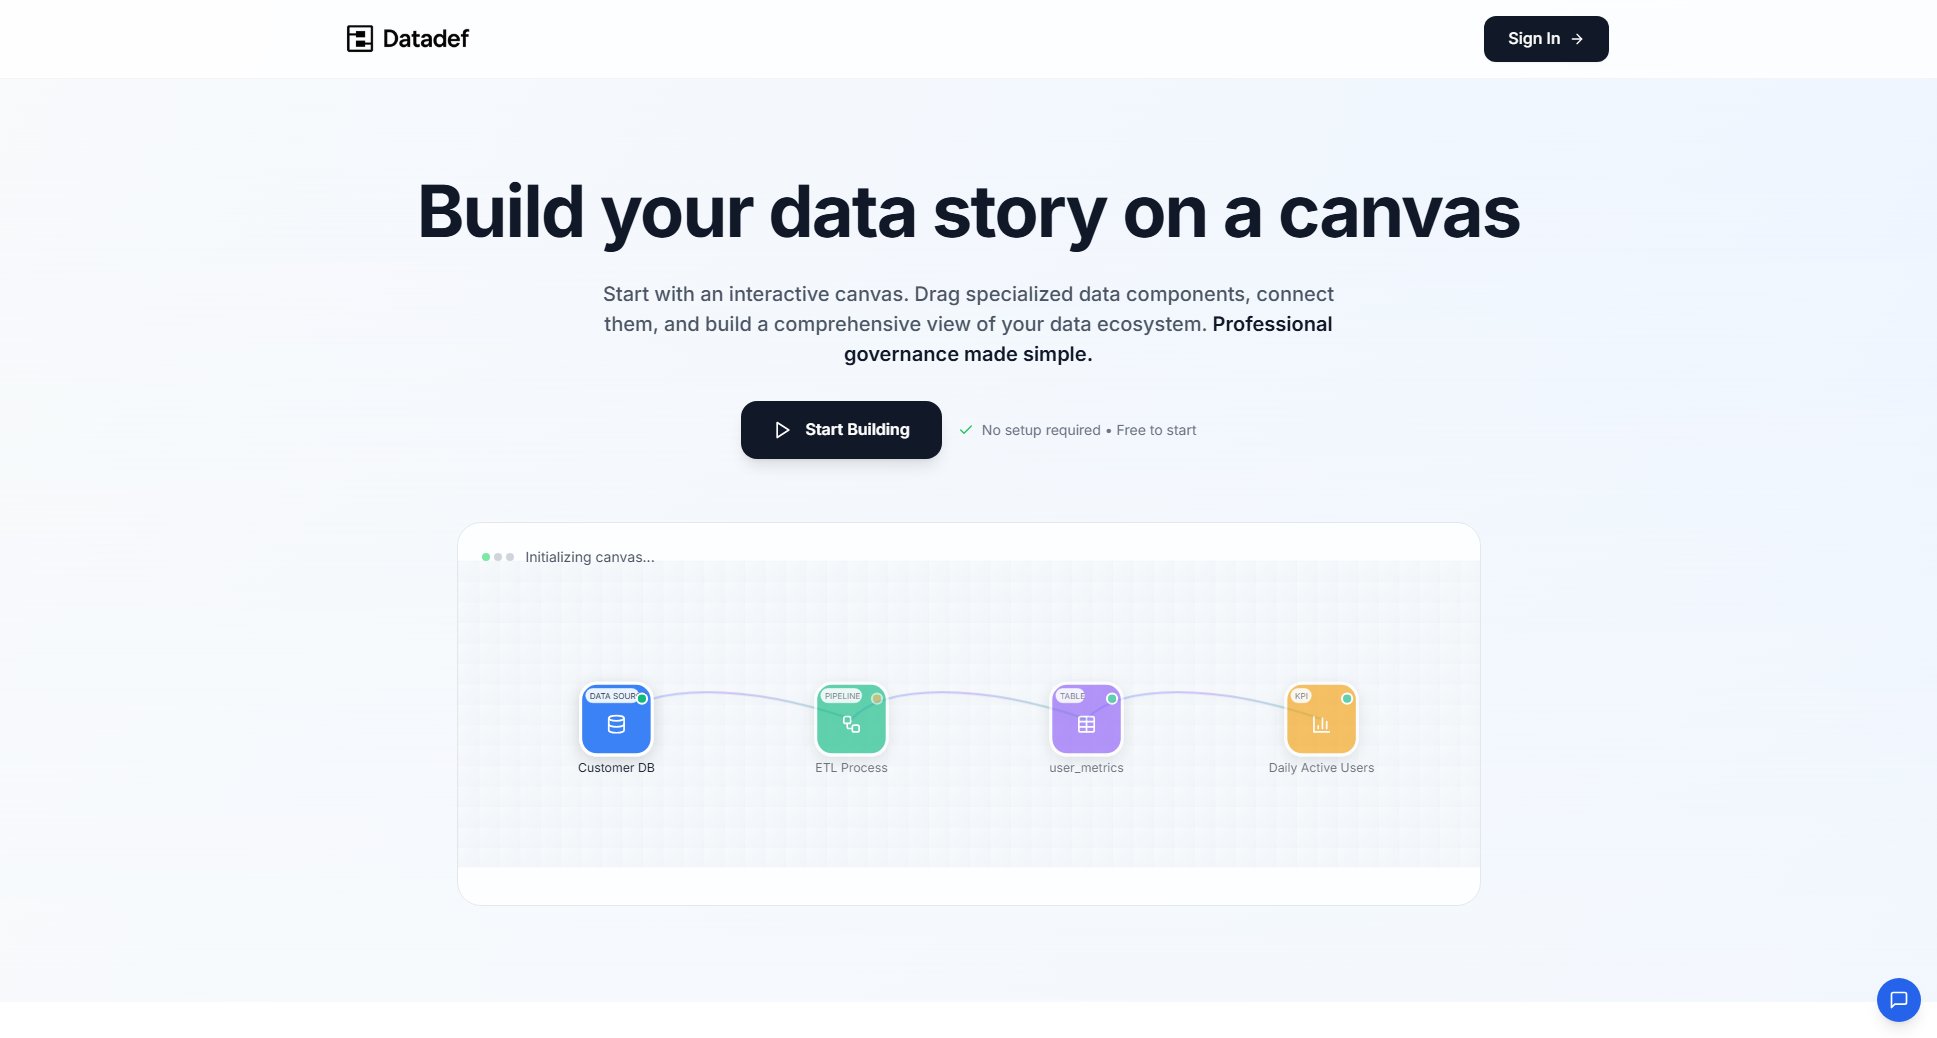
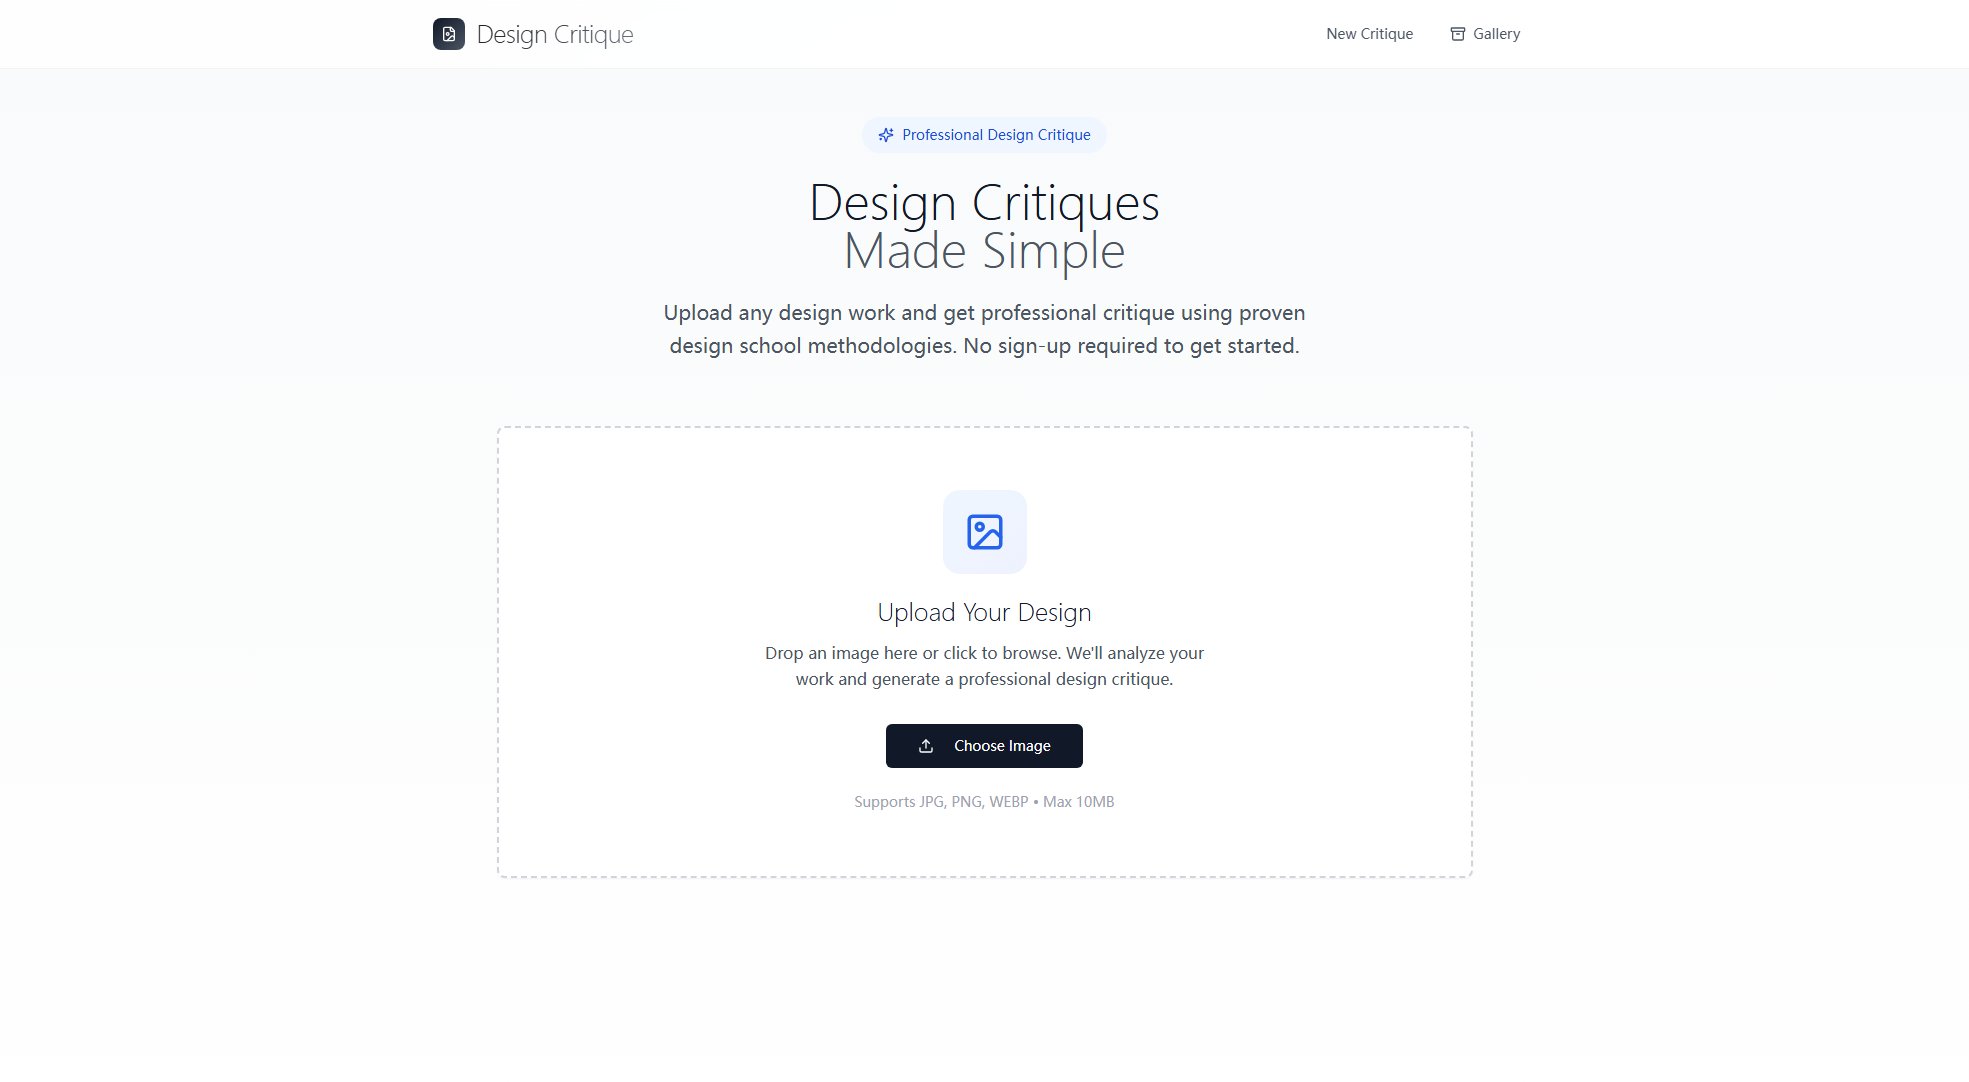
KnowDeck Official screenshot of the tool interface
What Can KnowDeck Do? Key Features
Complex Diagram Showcase
KnowDeck allows users to create and showcase complex diagrams for various domains such as algorithms, data structures, and network architectures. This feature supports multiple visualization tools and libraries, enabling users to present intricate concepts with clarity and precision.
Interactive Visualizations
The platform offers interactive diagrams with enhanced styling, allowing users to engage with the content dynamically. This feature is particularly useful for educational purposes, as it helps learners grasp complex topics through hands-on interaction.
Algorithm Flow Visualization
KnowDeck provides specialized tools for visualizing algorithm flows, such as binary search trees and other data structures. This feature aids in understanding the step-by-step execution of algorithms, making it a valuable resource for students and developers.
Data Structures Comparison
Users can compare different data structures side by side, such as queues, stacks, linked lists, and arrays. This feature highlights the differences and use cases of each structure, facilitating a deeper understanding of their applications.
Machine Learning Pipeline Visualization
KnowDeck supports the visualization of machine learning pipelines, helping users to comprehend the flow and components of ML models. This feature is ideal for data scientists and ML practitioners who need to present their work clearly.
Best KnowDeck Use Cases & Applications
Educational Presentations
Educators can use KnowDeck to create interactive diagrams and visualizations for teaching complex topics like algorithms and data structures. This enhances student engagement and understanding.
Professional Demonstrations
Professionals can leverage KnowDeck to visualize and present network architectures or machine learning pipelines, making technical concepts accessible to stakeholders and team members.
Self-Learning
Students and self-learners can use KnowDeck to explore and interact with visualizations, reinforcing their understanding of challenging subjects through hands-on learning.
How to Use KnowDeck: Step-by-Step Guide
Visit the KnowDeck website and log in to access extended usage and better model support. Currently, Chrome is recommended for the best experience, as Safari may have compatibility issues.
Explore the available visualization tools and libraries. Choose the type of diagram or visualization you want to create, such as a binary search tree, algorithm flow, or data structure comparison.
Customize your visualization by adding elements, styling components, and adjusting the layout. Utilize the interactive features to enhance the engagement and clarity of your diagram.
Save your work and share it with others. KnowDeck allows you to present your visualizations directly from the platform or export them for use in other applications.
KnowDeck Pros and Cons: Honest Review
Pros
Considerations
Is KnowDeck Worth It? FAQ & Reviews
KnowDeck is currently in early phases, and while some features may be accessible without cost, extended usage and better model support may require logging in. Pricing details are not yet publicly available.
KnowDeck recommends using Chrome for the best experience, as there are known issues with Safari. Other browsers may work but have not been officially tested.
KnowDeck supports a variety of visualizations, including algorithm flows, data structures, network architectures, and machine learning pipelines. The platform is continuously expanding its capabilities.
Yes, you can save and share your visualizations directly from the platform or export them for use in other applications.
KnowDeck is designed for students, educators, and professionals who need to visualize and present complex information in an intuitive and engaging manner.


