Datadef
Data Lineage Visualization for Professional Governance
What is Datadef? Complete Overview
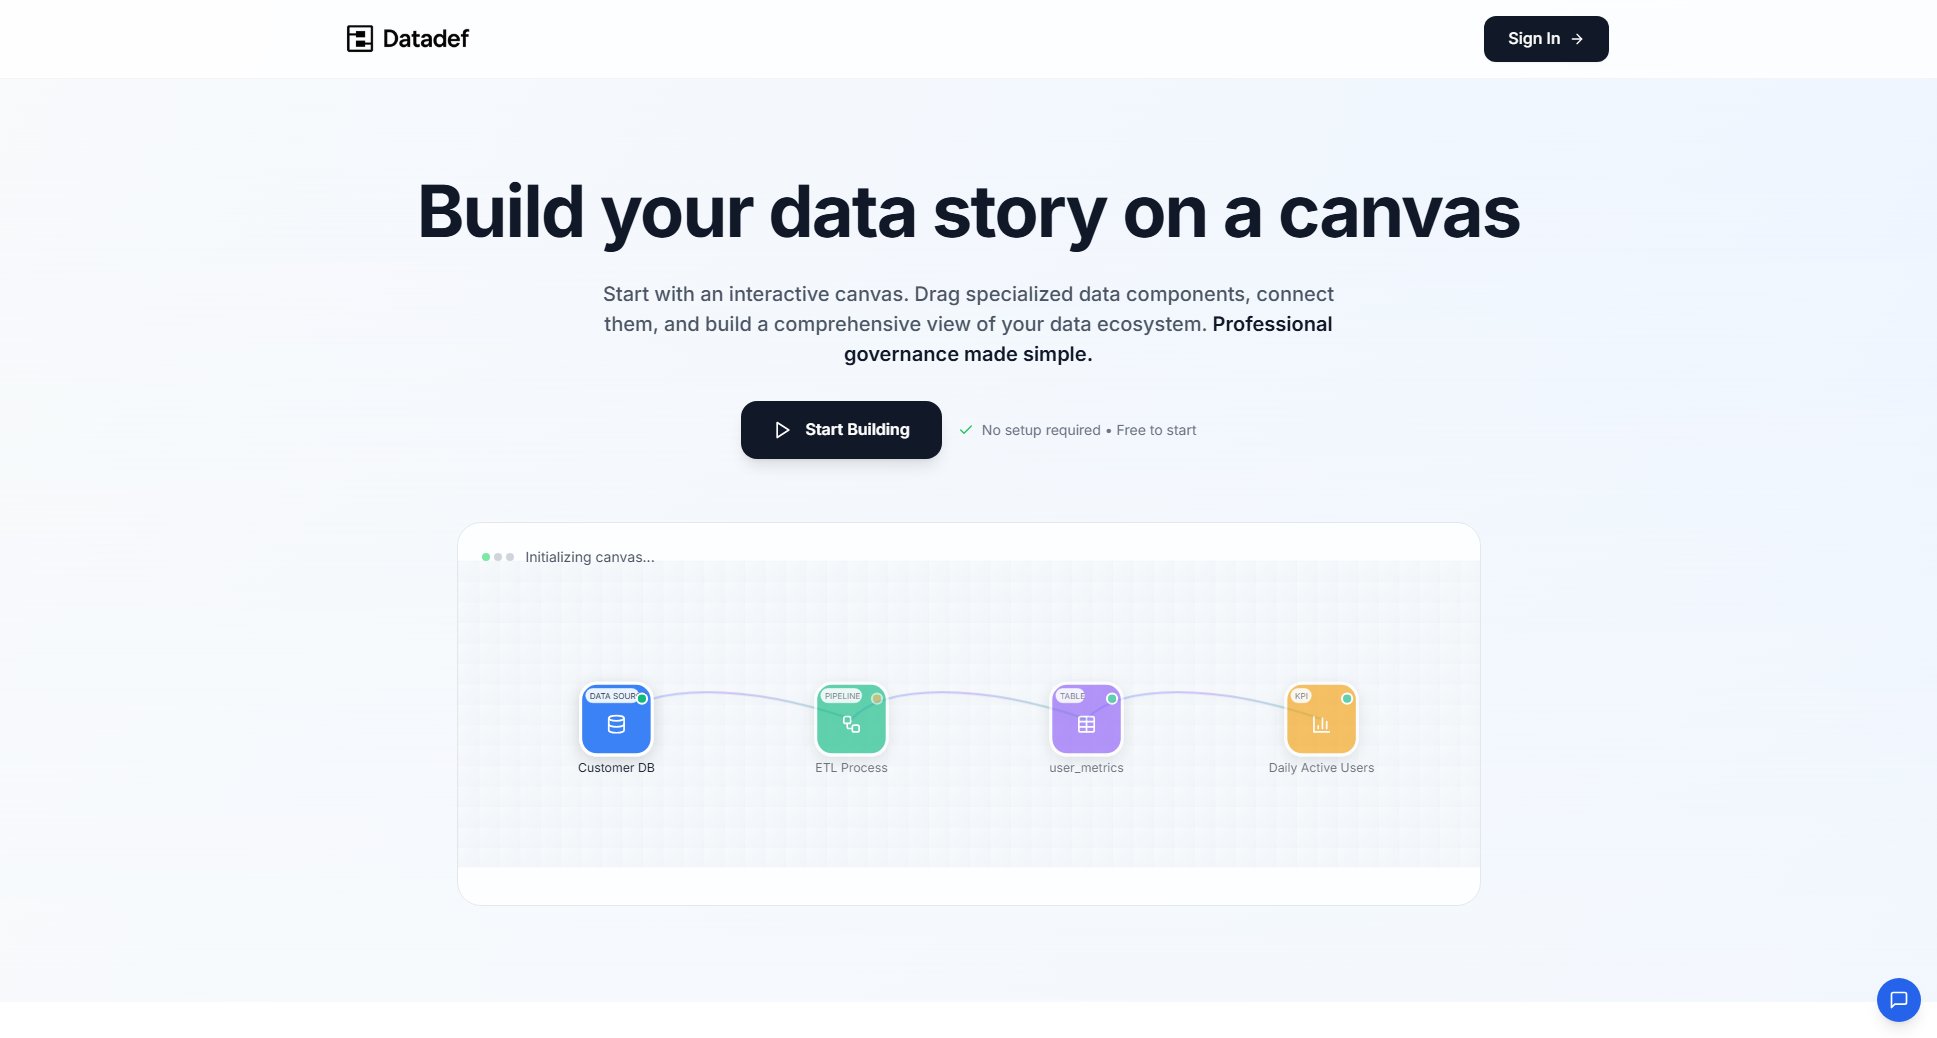
Datadef is a specialized tool designed for data professionals to visualize, document, and govern their data ecosystems. It offers an interactive canvas where users can drag and drop specialized data components to build comprehensive views of their data flows. The tool addresses key pain points in data governance by providing features like metadata management, KPI tracking, data lineage mapping, and AI-powered documentation. Target users include data engineers, analysts, and teams who need to make sense of complex data flows. With no setup required and a free starting tier, Datadef makes professional data governance accessible and straightforward.
Datadef Interface & Screenshots

Datadef Official screenshot of the tool interface
What Can Datadef Do? Key Features
Interactive Canvas Builder
Start with an interactive workspace designed for data professionals. Simply drag specialized components from the sidebar—no technical setup required. The canvas includes visual drag-and-drop interface with specialized data components, real-time auto-save, smart grid snapping, and unlimited canvas space that scales with your data ecosystem.
Data Source Connector
Connect your databases, APIs, and file systems with rich metadata capture. Track ownership, schedules, and data quality at the source level. Features include one-click connection templates for popular databases, automated schema discovery with column-level metadata, owner assignment, and SLA tracking with refresh schedules and quality monitoring.
Metadata Manager & KPI Builder
Enrich your data assets with comprehensive documentation. Define business KPIs and track data quality with automated scoring. Capabilities include automatic schema documentation with business-friendly descriptions, KPI builder with formula definitions, data quality scoring based on completeness, freshness, and accuracy, and business glossary integration.
Lineage Engine & Impact Analysis
Create intelligent connections between your data assets. Track transformations, dependencies, and impact analysis with visual lineage mapping. Features include smart relationship detection between tables and processes, visual transformation mapping with business logic capture, impact analysis for downstream effects of data changes, and automated lineage discovery from SQL queries and ETL scripts.
Business Glossary & Governance Hub
Establish a single source of truth for business terms and metrics. Create definitions with approval workflows and cross-reference capabilities. Includes business term definitions with approval workflows, metric formulas with calculation transparency, cross-referencing between glossary terms and data assets, and governance roles management.
AI Documentation Engine & Multi-format Export
Export comprehensive documentation tailored for different audiences. AI-powered summaries create executive briefings and technical specifications automatically. Features include multi-format exports (PDF, Excel, JSON), AI-generated executive summaries, stakeholder-specific views, and custom branding for professional presentations.
Best Datadef Use Cases & Applications
Data Governance Implementation
A data team at a mid-sized company uses Datadef to implement a comprehensive data governance framework. They document all data sources, define KPIs, and establish a business glossary, resulting in improved data quality and team alignment.
Regulatory Compliance
A financial institution leverages Datadef to map data lineage and document data flows for regulatory compliance audits. The visual lineage and automated documentation save significant time and ensure accuracy in reporting.
Onboarding New Team Members
A data engineering team uses Datadef to create visual documentation of their data ecosystem, making it easier for new hires to understand complex data flows and dependencies quickly.
How to Use Datadef: Step-by-Step Guide
Start by creating your canvas. Use the interactive workspace to drag and drop specialized data components like data sources, pipelines, tables, and KPIs. The intuitive interface requires no technical setup, allowing you to begin building immediately.
Configure your data sources by connecting to databases, APIs, or file systems. Utilize one-click connection templates for popular databases and automated schema discovery to capture metadata efficiently.
Document your tables and KPIs using the Metadata Manager and KPI Builder. Enrich your data assets with business-friendly descriptions and define KPIs with calculation logic. Monitor data quality with automated scoring.
Map data lineage to visualize relationships and transformations between data assets. Use the Lineage Engine to detect connections and perform impact analysis to understand downstream effects of changes.
Build a central glossary to standardize business terms and metrics. Establish governance with approval workflows and cross-referencing capabilities to ensure consistency and clarity across your organization.
Generate professional documentation using the AI-powered engine. Export your work in multiple formats (PDF, Excel, JSON) tailored for different stakeholders, from executives to technical teams.
Datadef Pros and Cons: Honest Review
Pros
Considerations
Is Datadef Worth It? FAQ & Reviews
Yes, Datadef offers a free tier with basic canvas functionality and limited data source connections, perfect for getting started with data visualization and documentation.
Datadef supports one-click connections to popular databases like PostgreSQL, MySQL, and Snowflake, with automated schema discovery for easy metadata capture.
Yes, Datadef allows multi-format exports including PDF reports, Excel data dictionaries, and JSON for integration with other tools.
The AI analyzes your data canvas and generates comprehensive documentation automatically, including executive summaries, technical details, and business-friendly descriptions of your data assets.
Absolutely. The Enterprise plan includes advanced governance workflows, team collaboration tools, and priority support, making it ideal for larger organizations with complex data ecosystems.


